The Content section describes your imported published inventory: counts, formats and publication times. Additional video and reel metrics depend on platform availability.
Definitions by platform
| Platform | Using the reports | Individual metrics and calculations |
|---|---|---|
| Instagram Analytics | Metrics glossary | |
| Facebook Analytics | Metrics glossary | |
| TikTok | TikTok Analytics | Metrics glossary |
| YouTube | YouTube Analytics | Metrics glossary |
Data basis and freshness
ContentMate imports platform data regularly in the background, aggregates it and displays it from its own database. Opening a dashboard, switching tabs or changing periods does not trigger a live request to Instagram, Facebook or TikTok.
Distinguish three levels:
- Period activity: Reported actions or observed changes within a time window. TikTok values are derived from imported video totals; an older publication can continue generating activity.
- Publication cohort: Posts published during the period, with their available imported lifetime values. These can include interactions generated after the publication date.
- Snapshot: A count such as followers or an audience distribution. These values are not summed across days.
Today/Yesterday may use an hourly view. An hourly chart does not mean the platform provides new complete data every hour. Import time, aggregation time and data time describe different things. Processing delays, permissions and report limits can leave gaps. The display does not promise real-time data or a fixed six-hour schedule.
Missing is not zero: Zero is a reported or correctly calculated value with no activity. A dash, “Unavailable” or an incomplete series must not be treated as zero in your own calculations.
Open this section
Open Analytics, choose the account and the relevant tab. The period filter determines the included reports; exceptions are labelled in their respective views.
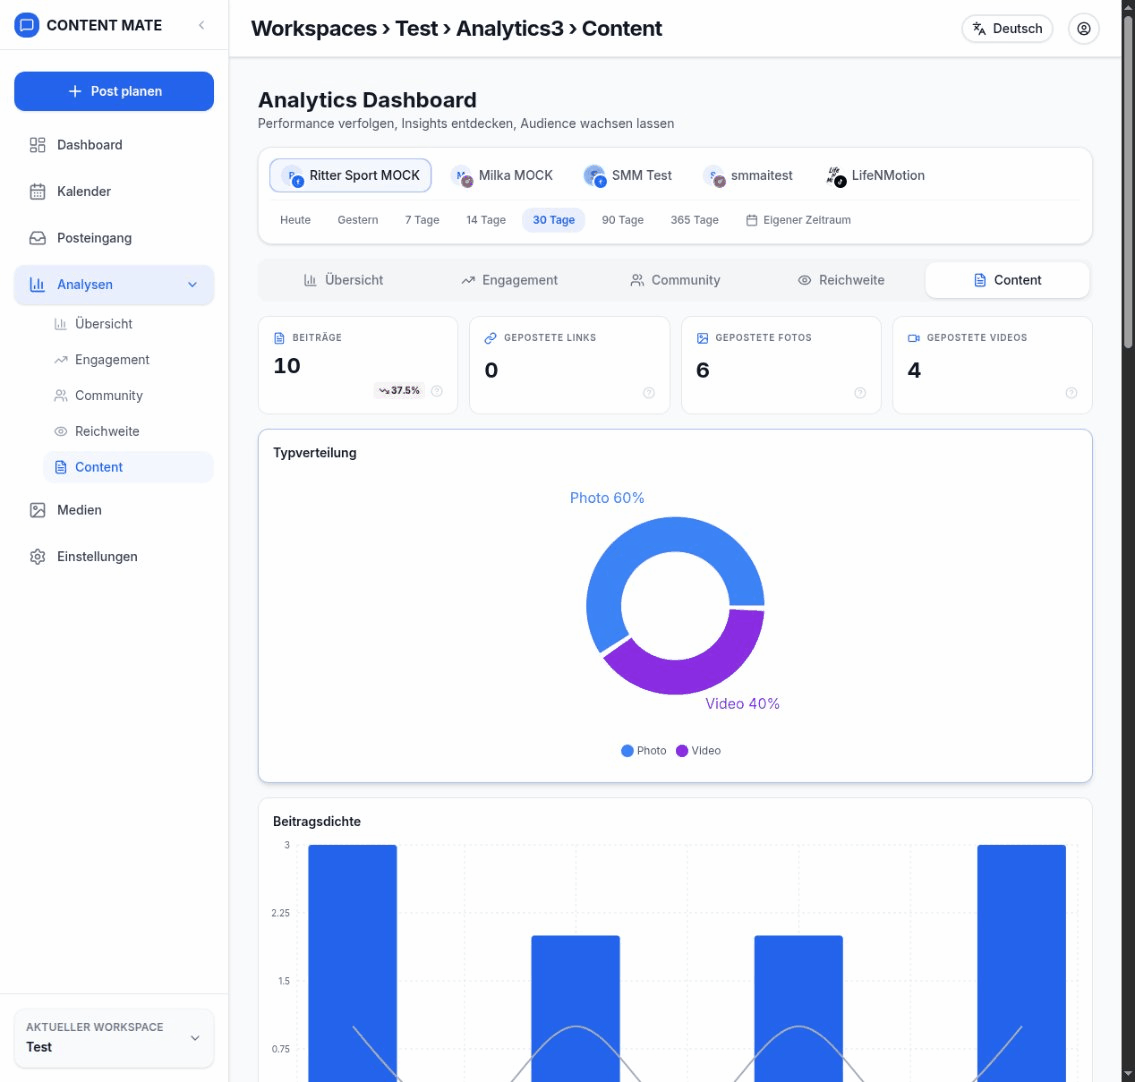
The help sections below also explain metrics from individual-media views. Not all historical video and reel cards are enabled as dashboard blocks. In All Media, the detail view can contain available video values even when a corresponding dashboard block is absent.
KPI Cards
A KPI card shows a metric and, where available, its comparison value, change and small trend chart. Check data freshness and notices about unavailable or incomplete data. A dash is not a confirmed zero. Not every platform supports every card.
Posts
The number of imported published posts whose publication date falls within the selected period. Drafts and posts that are only scheduled are not published posts. Availability depends on the imported inventory and supported formats; posts created in ContentMate are not the only possible source.
Links Posted
Imported posts classified as link posts, particularly on Facebook. A link in a caption, biography or story does not automatically turn that content into a link post in this distribution. This metric counts posts, not clicked URLs.
Photos Posted
Imported posts classified in the relevant photo format. A carousel is one post containing multiple media items, so image count and post count differ. See the platform guide for format mapping. The TikTok analytics import used here covers videos and does not promise photo-post analytics.
Videos Posted
The number of imported published videos according to the format mapping used. Separate reel groups may differ from general video groups. Add groups only when their classification is mutually exclusive. This counts publications, not plays.
Complete Video Views
The Facebook report behind this label uses a 30-second/completion metric. It must not be interpreted indiscriminately as “every video watched to its final frame”. A time or completion condition applies depending on video and report. See the Facebook glossary for the exact definition and current availability. Do not divide it by an arbitrary view count to produce a seemingly exact completion rate.
15-Second Video Views
The 15-second metric available for the Facebook video report. The platform definition determines the threshold and treatment of shorter videos. It differs from views, 3-second views and unique viewers. It is unavailable without a matching import.
Total Time Watched
Total watch time from the relevant video report. Check the displayed unit: raw platform values may be milliseconds while the interface formats durations. For example, 120,000 milliseconds equals 120 seconds or two minutes. This duration is neither video length nor viewer count.
Avg Time Watched
Average watch time according to the report definition. For a calculated ratio, total watch time and view count must cover the same report; native averages may use another denominator. Daily averages are not added. An average does not mean that all viewers left at exactly that point.
Reels Posted
The number of publications imported as reels during the period. This is a count of content in a format, not plays. Check the platform classification and any overlap with “Videos”.
Reels Plays
Reported reel plays according to the platform’s definition. Repeats may be included; this is not a count of unique viewers. Facebook and Instagram plays must not be compared without checking their definitions, even when labels look similar.
Avg Reels Plays
Average plays per included reel. For example, 900 reported plays across three included reels gives 300 per reel. Check the available reel sample and the plays’ period basis before using this as an expectation for a new reel.
Reels Total Time Watched
Total watch time from the relevant video report. Check the displayed unit: raw platform values may be milliseconds while the interface formats durations. For example, 120,000 milliseconds equals 120 seconds or two minutes. This duration is neither video length nor viewer count.
Reels Avg Time Watched
Average watch time according to the report definition. For a calculated ratio, total watch time and view count must cover the same report; native averages may use another denominator. Daily averages are not added. An average does not mean that all viewers left at exactly that point.
Reels Reactions
Reported reactions for the included reels. These are a format-specific subset and must not be added again to a total that already includes all formats. Cards and charts can use lifetime totals or period values; check the description.
Reels Comments
Reported comments for the included reels. These are a format-specific subset and must not be added again to a total that already includes all formats. Cards and charts can use lifetime totals or period values; check the description.
Reels Shares
Reported shares for the included reels. These are a format-specific subset and must not be added again to a total that already includes all formats. Cards and charts can use lifetime totals or period values; check the description.
Reels Reach
Available reach for the included reels. A sum of individual reel reach does not deduplicate across reels. If the same 100 accounts see two reels, their individual values can total 200 without reaching 200 different accounts. Note any label identifying an average or derived sum.
Reels Followers Gained
New followers attributed to reels, where Facebook supplies that attribution. This does not automatically include all Page follower gains. Without the matching report, it cannot be calculated from reel views or the total follower count.
Charts
Charts use imported and aggregated data. Check axis units, time granularity and gaps. A daily series, a current total and the lifetime values of published posts are not interchangeable. Percentages and averages must not simply be added across days.
Type Distribution
The distribution of imported posts by format. Format share = posts in that format ÷ all included posts × 100. Four photos among ten posts gives 40%. This describes your published inventory; it measures neither share of reach nor share of engagement.
Posting Density
Bars show the sum of posts for each weekday across available daily values. The line shows average posts per available day of that weekday. Four recorded Tuesdays with 1, 0, 2 and 1 posts, for example, give four posts in total and an average of one per Tuesday. Missing daily values are not automatically zero-post days. This distribution measures publishing frequency, not the best times for reach.
Post History
The number of published imported posts per displayed time bucket, assigned by publication date. This is not a view-count series. A publication missing from the import may also be missing from this history.
Monthly Distribution
Imported publications grouped by month and, where applicable, year. Monthly totals depend on the included data; an incomplete current month should not be compared with a full earlier month without accounting for that difference.
Video Complete Views History
The history of the available Facebook 30-second/completion metric. The same counting rules and limitations as the corresponding KPI apply. It is not an audience-retention analysis for individual video seconds.
15s Video Views History
The history of the reported 15-second video metric. Compare it only with video values from the same source and coverage. Missing reports remain unavailable.
Video Views by Source
The video-view breakdown supplied by Facebook, such as organic and paid, where available. Categories and coverage depend on the report. A missing paid value does not prove that no advertising was involved.
Video Play Type
Available video views split by automatic and active starts. Autoplay does not prove disinterest, and an active start does not prove a completed view. The report’s view threshold applies to both groups.
Most Viewed Videos
Videos in the report ranked by available views. Check which videos are included and whether their imported values are lifetime totals. A ranking by views differs from a ranking by watch duration or completed views.
Reels History Charts
Available reel metrics over time. Each series retains its own unit and counting rule. Reach values are not added into unique period reach; average durations and rates are not summed. Gaps limit comparisons.
YouTube comparison
YouTube
- The Content section shows imported videos and available video metrics. A video’s lifetime totals differ from channel activity during the selected period.
- Video views, engaged views, watch time, average view duration, and average percentage viewed have different units. Daily averages and percentages are not added together.
- Facebook metrics such as 15-second views and Instagram Reels metrics do not automatically apply to YouTube Shorts.
See YouTube analytics for video reports and missing data.
Compare values meaningfully
- Compare the same platform, metric definition and period. There is no universal threshold that makes an engagement rate “good”.
- Separate counts, unique reach, total snapshots, averages and ratios. A high number alone establishes neither quality nor a particular cause.
- Check import and aggregation status, account permissions and gaps. An empty view after connecting may be waiting for its first import.
- When values differ from the platform, compare the same account, report, period and data freshness. Historical values may be corrected later.